PBI data index · 2026 edition
England and Wales New-Build Affordability Index
A confidence-filtered view of where new homes cost the most and least relative to local earnings, built from official prices, pay and sales data.
- England and Wales
- 9.09×
- -0.25 ratio points from 2024
- Headline markets
- 149
- At least 100 registered new-build sales
- Lowest eligible ratio
- 5.38×
- Liverpool · 124 sales
- Highest eligible ratio
- 15.64×
- Tower Hamlets · 276 sales
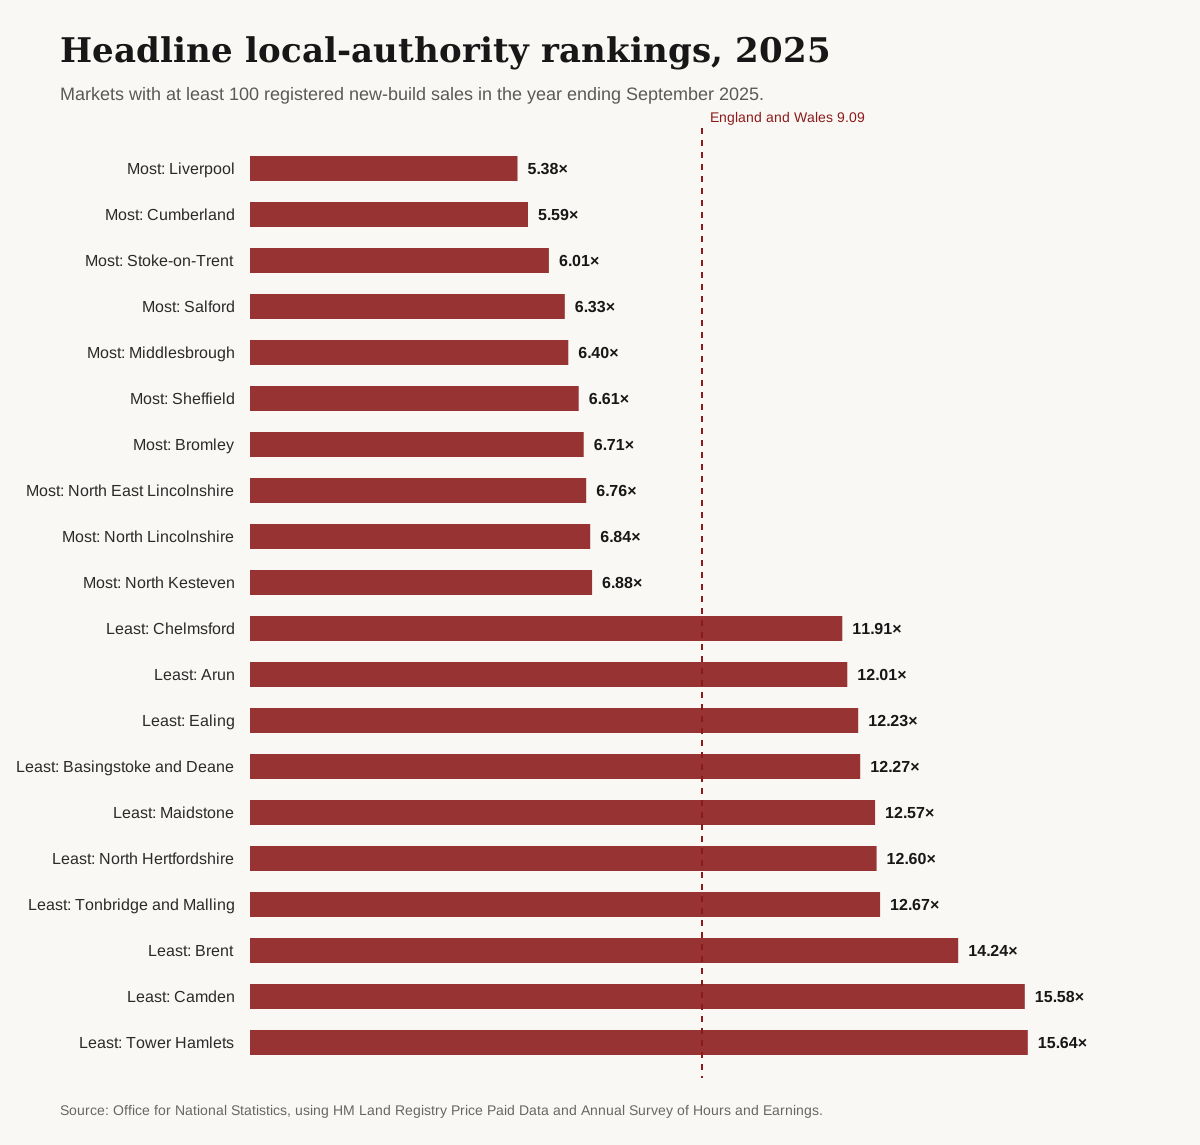
Most affordable eligible markets
Least affordable eligible markets
Regional comparison
London remains the least affordable region
The regional ratio ranges from 7.62 in the North East to 11.62 in London. This uses the official regional series, not an average of local-authority ratios.
Download regional chart (SVG)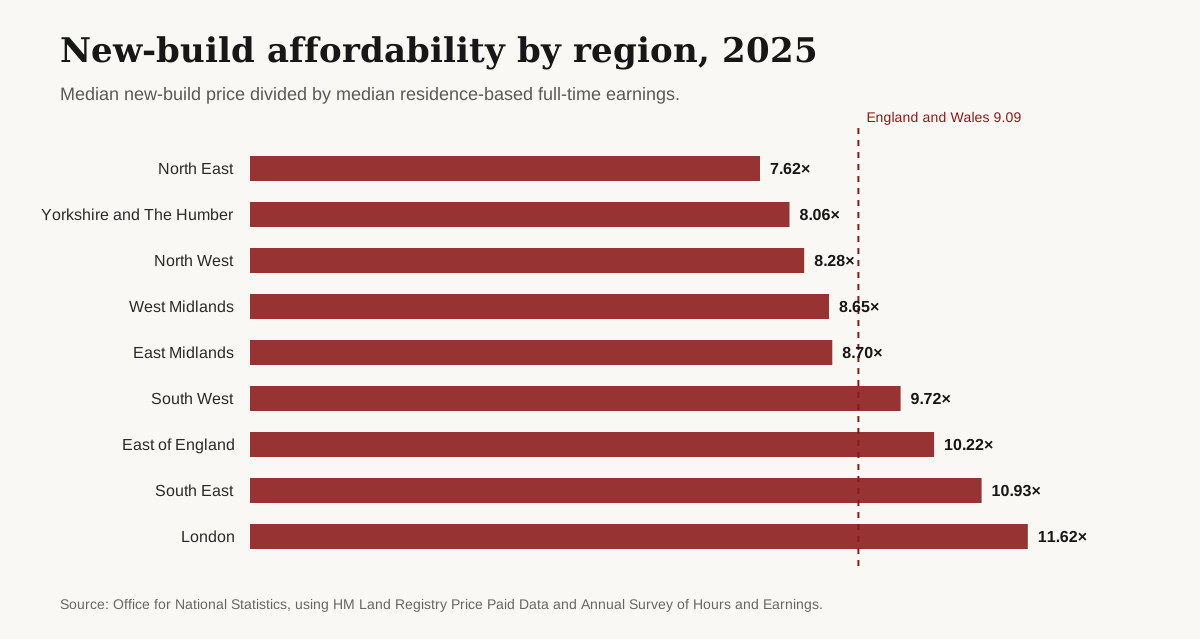
Dashed marker: England and Wales, 9.09×
Long-run context
Affordability improved in 2025, but remains stretched
The England and Wales ratio fell from 9.34 in 2024 to 9.09 in 2025. The series measures the relationship between prices and earnings, not mortgage costs or deposit requirements.
Download history chart (SVG)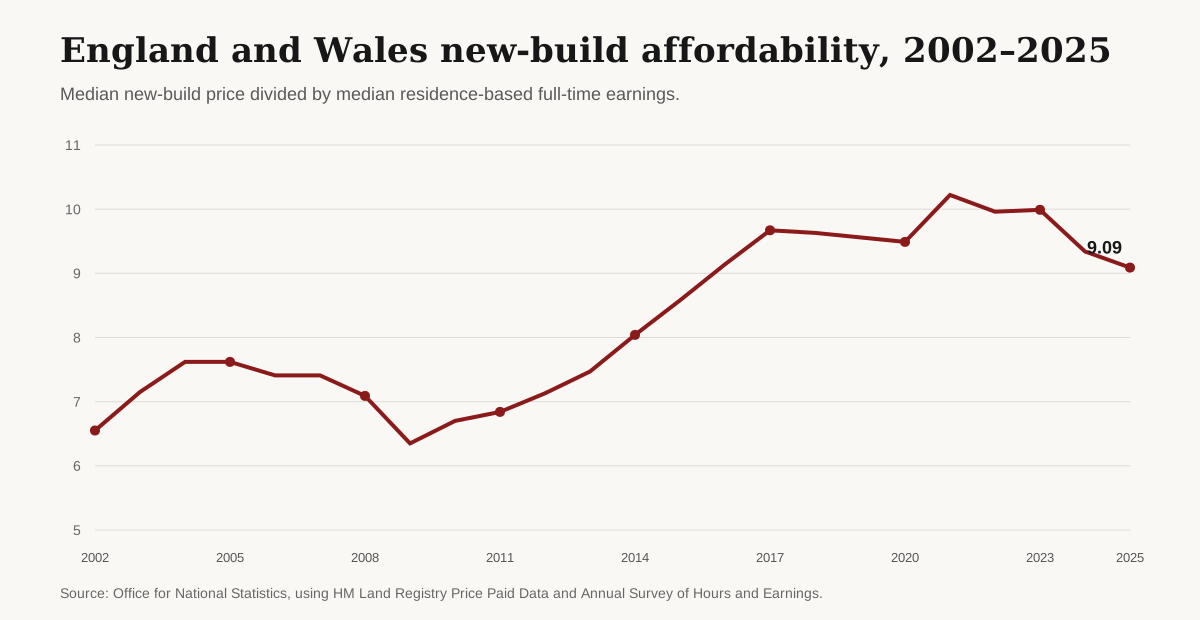
Interactive data
Compare every local authority
Search the 305 publishable markets, filter by evidence strength and sort by affordability, premium or transaction volume. Only markets with at least 100 sales receive a headline rank.
Showing 305 of 305 local authorities
| Rank | Local authority | Confidence | Ratio | New-build price | Earnings | Sales | Premium | 5-year change |
|---|---|---|---|---|---|---|---|---|
| 1 | LiverpoolNorth West · E08000012 | Headline | 5.38× | £199,998 | £37,144 | 124 | +11.1% | +2.66 |
| 2 | CumberlandNorth West · E06000063 | Headline | 5.59× | £237,500 | £42,461 | 281 | +38.9% | -0.85 |
| 3 | Stoke-on-TrentWest Midlands · E06000021 | Headline | 6.01× | £195,995 | £32,622 | 135 | +28.5% | -1.58 |
| 4 | SalfordNorth West · E08000006 | Headline | 6.33× | £221,135 | £34,958 | 483 | -3.9% | -2.19 |
| 5 | MiddlesbroughNorth East · E06000002 | Headline | 6.40× | £225,145 | £35,177 | 103 | +51.6% | -0.94 |
| 6 | SheffieldYorkshire and The Humber · E08000039 | Headline | 6.61× | £250,498 | £37,885 | 132 | +16.0% | -0.57 |
| 7 | BromleyLondon · E09000006 | Headline | 6.71× | £343,875 | £51,225 | 104 | -35.1% | -3.93 |
| 8 | North East LincolnshireYorkshire and The Humber · E06000012 | Headline | 6.76× | £236,825 | £35,052 | 199 | +48.0% | +0.29 |
| 9 | North LincolnshireYorkshire and The Humber · E06000013 | Headline | 6.84× | £237,495 | £34,738 | 127 | +35.7% | +0.65 |
| 10 | North KestevenEast Midlands · E07000139 | Headline | 6.88× | £256,500 | £37,305 | 181 | +6.9% | -0.36 |
| 11 | DarlingtonNorth East · E06000005 | Headline | 6.91× | £249,897 | £36,166 | 220 | +53.3% | -2.33 |
| 12 | Kingston upon Hull, City ofYorkshire and The Humber · E06000010 | Headline | 7.00× | £220,000 | £31,419 | 214 | +63.0% | +0.33 |
| 13 | West LindseyEast Midlands · E07000142 | Headline | 7.01× | £269,000 | £38,377 | 176 | +22.3% | -0.25 |
| 14 | WiganNorth West · E08000010 | Headline | 7.08× | £264,750 | £37,377 | 214 | +38.6% | -0.31 |
| 15 | BroxtoweEast Midlands · E07000172 | Headline | 7.10× | £269,995 | £38,037 | 101 | +8.0% | -0.28 |
| 16 | DerbyEast Midlands · E06000015 | Headline | 7.14× | £259,950 | £36,428 | 151 | +19.6% | -1.04 |
| 17 | WyreNorth West · E07000128 | Headline | 7.20× | £273,950 | £38,048 | 110 | +44.6% | -3.26 |
| 18 | NorthumberlandNorth East · E06000057 | Headline | 7.21× | £271,972 | £37,721 | 456 | +39.5% | -1.15 |
| 19 | GatesheadNorth East · E08000037 | Headline | 7.28× | £248,995 | £34,199 | 117 | +55.6% | -1.52 |
| 20 | Newark and SherwoodEast Midlands · E07000175 | Headline | 7.46× | £276,995 | £37,118 | 185 | +17.9% | -0.03 |
| 20 | WakefieldYorkshire and The Humber · E08000036 | Headline | 7.46× | £256,495 | £34,400 | 254 | +29.9% | -0.39 |
| 22 | BassetlawEast Midlands · E07000171 | Headline | 7.48× | £259,950 | £34,744 | 197 | +35.0% | -0.98 |
| 23 | BirminghamWest Midlands · E08000025 | Headline | 7.50× | £269,950 | £35,989 | 421 | +16.4% | -0.08 |
| 24 | South DerbyshireEast Midlands · E07000039 | Headline | 7.51× | £312,000 | £41,520 | 237 | +25.8% | -0.29 |
| 25 | Stockton-on-TeesNorth East · E06000004 | Headline | 7.59× | £285,000 | £37,558 | 203 | +70.8% | -0.56 |
| 26 | East LindseyEast Midlands · E07000137 | Headline | 7.61× | £239,950 | £31,516 | 227 | +11.6% | -0.75 |
| 27 | DoncasterYorkshire and The Humber · E08000017 | Headline | 7.72× | £269,995 | £34,967 | 129 | +56.5% | +1.69 |
| 28 | South HollandEast Midlands · E07000140 | Headline | 7.73× | £249,950 | £32,336 | 195 | +6.9% | +1.30 |
| 29 | County DurhamNorth East · E06000047 | Headline | 7.84× | £261,972 | £33,436 | 480 | +94.0% | +0.83 |
| 29 | HartlepoolNorth East · E06000001 | Headline | 7.84× | £250,000 | £31,871 | 154 | +72.4% | +0.16 |
| 31 | DoverSouth East · E07000108 | Headline | 7.86× | £315,395 | £40,142 | 179 | +8.8% | -0.55 |
| 32 | East Riding of YorkshireYorkshire and The Humber · E06000011 | Headline | 7.90× | £297,172 | £37,595 | 626 | +38.2% | -0.63 |
| 33 | BarnsleyYorkshire and The Humber · E08000038 | Headline | 7.91× | £289,995 | £36,652 | 218 | +65.7% | 0.00 |
| 34 | CoventryWest Midlands · E08000026 | Headline | 7.93× | £299,250 | £37,759 | 201 | +33.0% | +1.34 |
| 35 | SunderlandNorth East · E08000024 | Headline | 7.94× | £259,950 | £32,744 | 188 | +79.3% | +0.52 |
| 36 | North TynesideNorth East · E08000022 | Headline | 7.96× | £294,950 | £37,063 | 136 | +43.9% | -1.21 |
| 37 | SeftonNorth West · E08000014 | Headline | 7.97× | £294,500 | £36,937 | 205 | +30.9% | +0.49 |
| 38 | Rhondda Cynon TafWales · W06000016 | Headline | 7.98× | £277,995 | £34,837 | 110 | +79.3% | -0.46 |
| 39 | BradfordYorkshire and The Humber · E08000032 | Headline | 8.03× | £269,325 | £33,526 | 187 | +49.6% | -0.01 |
| 40 | KirkleesYorkshire and The Humber · E08000034 | Headline | 8.19× | £293,745 | £35,867 | 270 | +45.4% | -0.99 |
| 41 | NewportWales · W06000022 | Headline | 8.21× | £299,995 | £36,533 | 143 | +33.3% | -1.51 |
| 41 | StaffordWest Midlands · E07000197 | Headline | 8.21× | £325,995 | £39,726 | 147 | +30.4% | -0.63 |
| 43 | North East DerbyshireEast Midlands · E07000038 | Headline | 8.24× | £299,995 | £36,422 | 124 | +30.4% | +0.07 |
| 43 | South RibbleNorth West · E07000126 | Headline | 8.24× | £312,250 | £37,883 | 124 | +48.7% | +0.25 |
| 45 | West LancashireNorth West · E07000127 | Headline | 8.27× | £315,000 | £38,102 | 101 | +34.0% | +0.67 |
| 46 | Telford and WrekinWest Midlands · E06000020 | Headline | 8.31× | £299,500 | £36,044 | 248 | +36.1% | -0.29 |
| 47 | KnowsleyNorth West · E08000011 | Headline | 8.32× | £312,545 | £37,543 | 205 | +71.3% | +0.95 |
| 48 | North West LeicestershireEast Midlands · E07000134 | Headline | 8.38× | £325,000 | £38,795 | 241 | +25.0% | -1.22 |
| 48 | Ribble ValleyNorth West · E07000124 | Headline | 8.38× | £342,500 | £40,870 | 106 | +27.9% | -0.01 |
| 50 | Amber ValleyEast Midlands · E07000032 | Headline | 8.45× | £318,912 | £37,756 | 214 | +43.3% | +1.42 |
| 51 | Cheshire West and ChesterNorth West · E06000050 | Headline | 8.46× | £350,995 | £41,486 | 167 | +39.0% | +0.83 |
| 51 | Wyre ForestWest Midlands · E07000239 | Headline | 8.46× | £293,300 | £34,661 | 158 | +16.3% | -0.31 |
| 53 | North NorthamptonshireEast Midlands · E06000061 | Headline | 8.51× | £322,950 | £37,951 | 571 | +29.2% | -0.61 |
| 54 | RugbyWest Midlands · E07000220 | Headline | 8.52× | £401,875 | £47,191 | 246 | +43.3% | -0.51 |
| 55 | Newcastle upon TyneNorth East · E08000021 | Headline | 8.58× | £303,995 | £35,446 | 306 | +55.9% | +1.20 |
| 56 | BolsoverEast Midlands · E07000033 | Headline | 8.62× | £283,570 | £32,897 | 136 | +67.8% | +2.24 |
| 57 | North YorkshireYorkshire and The Humber · E06000065 | Headline | 8.70× | £320,000 | £36,783 | 686 | +19.4% | -0.91 |
| 58 | PrestonNorth West · E07000123 | Headline | 8.72× | £324,500 | £37,214 | 209 | +82.3% | -0.12 |
| 59 | Blackburn with DarwenNorth West · E06000008 | Headline | 8.74× | £288,972 | £33,076 | 238 | +86.4% | -1.28 |
| 60 | AshfieldEast Midlands · E07000170 | Headline | 8.75× | £284,996 | £32,577 | 123 | +50.0% | -1.38 |
| 61 | GedlingEast Midlands · E07000173 | Headline | 8.76× | £330,500 | £37,727 | 126 | +36.3% | +1.24 |
| 62 | ShropshireWest Midlands · E06000051 | Headline | 8.79× | £324,995 | £36,991 | 271 | +19.9% | -0.51 |
| 63 | DudleyWest Midlands · E08000027 | Headline | 8.83× | £313,500 | £35,486 | 115 | +33.4% | +1.11 |
| 63 | South NorfolkEast of England · E07000149 | Headline | 8.83× | £348,375 | £39,438 | 174 | +16.5% | -0.74 |
| 63 | Westmorland and FurnessNorth West · E06000064 | Headline | 8.83× | £369,750 | £41,859 | 126 | +57.3% | -0.22 |
| 66 | FenlandEast of England · E07000010 | Headline | 8.85× | £302,500 | £34,170 | 112 | +34.1% | +0.66 |
| 67 | East CambridgeshireEast of England · E07000009 | Headline | 8.92× | £370,000 | £41,464 | 117 | +10.4% | -2.07 |
| 68 | Mid SuffolkEast of England · E07000203 | Headline | 8.95× | £370,000 | £41,350 | 303 | +25.4% | -0.63 |
| 69 | RushcliffeEast Midlands · E07000176 | Headline | 9.04× | £415,323 | £45,968 | 232 | +24.7% | -0.32 |
| 70 | East StaffordshireWest Midlands · E07000193 | Headline | 9.05× | £333,435 | £36,848 | 150 | +48.2% | -0.62 |
| 71 | East DevonSouth West · E07000040 | Headline | 9.11× | £365,000 | £40,087 | 189 | +9.9% | -0.40 |
| 72 | RotherhamYorkshire and The Humber · E08000018 | Headline | 9.15× | £317,695 | £34,713 | 264 | +71.7% | +2.11 |
| 73 | BroadlandEast of England · E07000144 | Headline | 9.16× | £350,000 | £38,195 | 268 | +16.7% | +0.63 |
| 74 | Nuneaton and BedworthWest Midlands · E07000219 | Headline | 9.18× | £323,975 | £35,277 | 212 | +39.6% | -0.89 |
| 74 | SwindonSouth West · E06000030 | Headline | 9.18× | £356,995 | £38,900 | 262 | +29.8% | -1.52 |
| 76 | East HampshireSouth East · E07000085 | Headline | 9.19× | £437,500 | £47,630 | 118 | +4.0% | -2.93 |
| 76 | HarboroughEast Midlands · E07000131 | Headline | 9.19× | £389,972 | £42,423 | 216 | +20.0% | -0.20 |
| 78 | MeltonEast Midlands · E07000133 | Headline | 9.22× | £312,498 | £33,900 | 164 | +19.3% | -1.62 |
| 79 | SomersetSouth West · E06000066 | Headline | 9.23× | £335,000 | £36,279 | 347 | +19.6% | +0.45 |
| 79 | West SuffolkEast of England · E07000245 | Headline | 9.23× | £365,750 | £39,628 | 163 | +29.4% | -0.44 |
| 81 | West NorthamptonshireEast Midlands · E06000062 | Headline | 9.25× | £351,496 | £38,000 | 541 | +20.2% | -1.14 |
| 82 | Malvern HillsWest Midlands · E07000235 | Headline | 9.27× | £328,420 | £35,429 | 159 | +1.1% | -1.75 |
| 83 | Stratford-on-AvonWest Midlands · E07000221 | Headline | 9.28× | £382,958 | £41,280 | 258 | +5.5% | -0.91 |
| 84 | Hinckley and BosworthEast Midlands · E07000132 | Headline | 9.39× | £335,000 | £35,671 | 122 | +30.9% | -0.55 |
| 85 | CornwallSouth West · E06000052 | Headline | 9.43× | £330,000 | £35,002 | 297 | +14.8% | -0.11 |
| 86 | King's Lynn and West NorfolkEast of England · E07000146 | Headline | 9.50× | £350,000 | £36,835 | 101 | +32.1% | +1.79 |
| 87 | East SuffolkEast of England · E07000244 | Headline | 9.51× | £350,000 | £36,793 | 203 | +24.6% | -0.32 |
| 87 | North SomersetSouth West · E06000024 | Headline | 9.51× | £380,000 | £39,969 | 239 | +22.6% | +0.42 |
| 87 | YorkYorkshire and The Humber · E06000014 | Headline | 9.51× | £385,000 | £40,496 | 121 | +28.3% | -1.12 |
| 90 | PeterboroughEast of England · E06000031 | Headline | 9.52× | £335,000 | £35,196 | 181 | +42.3% | +0.98 |
| 90 | South HamsSouth West · E07000044 | Headline | 9.52× | £367,875 | £38,638 | 108 | +0.8% | -0.18 |
| 92 | LichfieldWest Midlands · E07000194 | Headline | 9.57× | £400,000 | £41,803 | 103 | +29.0% | +0.76 |
| 93 | CharnwoodEast Midlands · E07000130 | Headline | 9.58× | £364,972 | £38,078 | 222 | +37.7% | +0.65 |
| 94 | Cheshire EastNorth West · E06000049 | Headline | 9.61× | £394,100 | £40,991 | 482 | +35.9% | +0.78 |
| 95 | WiltshireSouth West · E06000054 | Headline | 9.65× | £365,000 | £37,811 | 299 | +15.9% | -0.46 |
| 96 | LeedsYorkshire and The Humber · E08000035 | Headline | 9.67× | £354,972 | £36,716 | 408 | +47.9% | +0.98 |
| 97 | RochdaleNorth West · E08000005 | Headline | 9.68× | £335,495 | £34,660 | 108 | +67.8% | +2.54 |
| 98 | WinchesterSouth East · E07000094 | Headline | 9.78× | £447,500 | £45,766 | 174 | -2.7% | -2.02 |
| 99 | HaltonNorth West · E06000006 | Headline | 9.80× | £345,000 | £35,187 | 103 | +81.6% | +2.48 |
| 100 | WaverleySouth East · E07000216 | Headline | 9.85× | £490,000 | £49,769 | 125 | -10.9% | -1.80 |
| 101 | CanterburySouth East · E07000106 | Headline | 9.95× | £375,000 | £37,682 | 153 | +10.3% | -1.57 |
| 102 | Herefordshire, County ofWest Midlands · E06000019 | Headline | 9.98× | £346,500 | £34,730 | 130 | +17.9% | +0.49 |
| 103 | South CambridgeshireEast of England · E07000012 | Headline | 10.01× | £489,600 | £48,916 | 260 | +16.6% | -1.21 |
| 104 | WarwickWest Midlands · E07000222 | Headline | 10.05× | £487,500 | £48,523 | 201 | +39.3% | -0.46 |
| 105 | South KestevenEast Midlands · E07000141 | Headline | 10.15× | £354,498 | £34,922 | 112 | +36.4% | +1.03 |
| 106 | TendringEast of England · E07000076 | Headline | 10.18× | £405,000 | £39,799 | 299 | +48.9% | -0.86 |
| 107 | BoltonNorth West · E08000001 | Headline | 10.24× | £349,995 | £34,186 | 149 | +75.0% | +2.85 |
| 107 | South GloucestershireSouth West · E06000025 | Headline | 10.24× | £416,998 | £40,731 | 322 | +24.5% | -0.69 |
| 109 | GreenwichLondon · E09000011 | Headline | 10.27× | £465,000 | £45,274 | 177 | +2.2% | -4.28 |
| 110 | SwaleSouth East · E07000113 | Headline | 10.30× | £395,995 | £38,432 | 149 | +32.0% | +0.62 |
| 111 | Central BedfordshireEast of England · E06000056 | Headline | 10.31× | £449,995 | £43,645 | 412 | +26.8% | -0.04 |
| 112 | WealdenSouth East · E07000065 | Headline | 10.32× | £450,000 | £43,589 | 227 | +20.0% | -0.46 |
| 113 | TewkesburySouth West · E07000083 | Headline | 10.33× | £405,375 | £39,236 | 186 | +28.7% | -0.28 |
| 114 | Vale of White HorseSouth East · E07000180 | Headline | 10.35× | £459,995 | £44,454 | 339 | +17.6% | +0.42 |
| 115 | BrecklandEast of England · E07000143 | Headline | 10.36× | £356,250 | £34,399 | 185 | +38.6% | +1.14 |
| 116 | EastleighSouth East · E07000086 | Headline | 10.41× | £441,914 | £42,461 | 112 | +31.1% | +0.25 |
| 117 | South OxfordshireSouth East · E07000179 | Headline | 10.42× | £505,500 | £48,525 | 169 | +14.9% | +0.06 |
| 118 | CherwellSouth East · E07000177 | Headline | 10.51× | £443,000 | £42,147 | 220 | +26.6% | -0.02 |
| 119 | HuntingdonshireEast of England · E07000011 | Headline | 10.52× | £400,000 | £38,019 | 258 | +28.0% | -1.67 |
| 120 | ManchesterNorth West · E08000003 | Headline | 10.61× | £384,798 | £36,278 | 148 | +57.1% | +1.92 |
| 121 | DorsetSouth West · E06000059 | Headline | 10.68× | £400,000 | £37,462 | 277 | +15.9% | -0.97 |
| 122 | Mid SussexSouth East · E07000228 | Headline | 10.71× | £475,000 | £44,352 | 135 | +9.2% | -0.18 |
| 123 | East HertfordshireEast of England · E07000242 | Headline | 10.73× | £560,000 | £52,184 | 142 | +24.4% | -0.20 |
| 124 | BarnetLondon · E09000003 | Headline | 10.77× | £507,500 | £47,141 | 328 | -14.7% | -4.61 |
| 125 | BedfordEast of England · E06000055 | Headline | 10.86× | £447,475 | £41,214 | 242 | +34.8% | +1.02 |
| 126 | UttlesfordEast of England · E07000077 | Headline | 10.98× | £550,000 | £50,103 | 269 | +25.0% | -2.42 |
| 127 | BuckinghamshireSouth East · E06000060 | Headline | 11.00× | £476,250 | £43,290 | 426 | +5.8% | -0.42 |
| 128 | RochfordEast of England · E07000075 | Headline | 11.02× | £492,995 | £44,750 | 124 | +23.3% | -1.87 |
| 129 | WokinghamSouth East · E06000041 | Headline | 11.11× | £580,000 | £52,222 | 178 | +20.8% | -0.26 |
| 130 | Milton KeynesSouth East · E06000042 | Headline | 11.20× | £463,500 | £41,389 | 371 | +38.4% | -0.08 |
| 131 | CardiffWales · W06000015 | Headline | 11.42× | £422,000 | £36,946 | 155 | +60.8% | +2.58 |
| 132 | ColchesterEast of England · E07000071 | Headline | 11.43× | £450,000 | £39,353 | 142 | +39.6% | +1.44 |
| 133 | BraintreeEast of England · E07000067 | Headline | 11.52× | £457,472 | £39,712 | 210 | +37.4% | +1.01 |
| 134 | StroudSouth West · E07000082 | Headline | 11.56× | £446,500 | £38,608 | 122 | +37.4% | +1.97 |
| 135 | BaberghEast of England · E07000200 | Headline | 11.65× | £395,000 | £33,904 | 157 | +22.9% | +1.35 |
| 136 | HaringeyLondon · E09000014 | Headline | 11.68× | £514,000 | £43,995 | 106 | -10.9% | -0.41 |
| 137 | HackneyLondon · E09000012 | Headline | 11.70× | £578,800 | £49,482 | 129 | -0.2% | -9.99 |
| 138 | NewhamLondon · E09000025 | Headline | 11.77× | £501,481 | £42,595 | 352 | +16.6% | -2.59 |
| 139 | West BerkshireSouth East · E06000037 | Headline | 11.85× | £532,000 | £44,887 | 136 | +33.0% | +1.65 |
| 140 | ChelmsfordEast of England · E07000070 | Headline | 11.91× | £550,000 | £46,179 | 100 | +35.8% | -0.98 |
| 141 | ArunSouth East · E07000224 | Headline | 12.01× | £415,000 | £34,546 | 218 | +22.1% | -0.23 |
| 142 | EalingLondon · E09000009 | Headline | 12.23× | £500,000 | £40,889 | 107 | -8.3% | -0.86 |
| 143 | Basingstoke and DeaneSouth East · E07000084 | Headline | 12.27× | £550,000 | £44,809 | 106 | +54.7% | +2.16 |
| 144 | MaidstoneSouth East · E07000110 | Headline | 12.57× | £480,000 | £38,191 | 103 | +33.3% | +0.91 |
| 145 | North HertfordshireEast of England · E07000099 | Headline | 12.60× | £620,000 | £49,224 | 155 | +50.7% | -3.12 |
| 146 | Tonbridge and MallingSouth East · E07000115 | Headline | 12.67× | £541,496 | £42,752 | 107 | +32.1% | +2.61 |
| 147 | BrentLondon · E09000005 | Headline | 14.24× | £568,700 | £39,944 | 193 | +3.4% | +2.53 |
| 148 | CamdenLondon · E09000007 | Headline | 15.58× | £828,000 | £53,133 | 103 | +8.9% | -8.67 |
| 149 | Tower HamletsLondon · E09000030 | Headline | 15.64× | £813,305 | £52,000 | 276 | +72.3% | +1.93 |
| — | AdurSouth East · E07000223 | Low volume | 11.85× | £462,500 | £39,029 | 40 | +23.3% | +1.97 |
| — | AshfordSouth East · E07000105 | Indicative | 12.79× | £478,750 | £37,440 | 78 | +40.8% | +0.54 |
| — | Barking and DagenhamLondon · E09000002 | Indicative | 8.98× | £345,600 | £38,467 | 55 | -8.7% | -1.58 |
| — | BasildonEast of England · E07000066 | Low volume | 13.59× | £540,000 | £39,734 | 34 | +50.0% | +1.10 |
| — | Bath and North East SomersetSouth West · E06000022 | Indicative | 13.97× | £565,000 | £40,448 | 69 | +44.9% | +2.25 |
| — | BexleyLondon · E09000004 | Low volume | 7.85× | £345,000 | £43,969 | 21 | -19.8% | -2.86 |
| — | BlabyEast Midlands · E07000129 | Indicative | 9.70× | £371,148 | £38,279 | 72 | +32.5% | +1.53 |
| — | Blaenau GwentWales · W06000019 | Low volume | 7.72× | £268,495 | £34,797 | 16 | +91.8% | +0.62 |
| — | BostonEast Midlands · E07000136 | Indicative | 7.72× | £229,950 | £29,805 | 79 | +15.0% | -0.44 |
| — | Bournemouth, Christchurch and PooleSouth West · E06000058 | Low volume | 11.26× | £422,250 | £37,493 | 48 | +24.2% | +1.86 |
| — | Bracknell ForestSouth East · E06000036 | Indicative | 13.78× | £595,200 | £43,206 | 99 | +48.8% | +1.63 |
| — | BrentwoodEast of England · E07000068 | Low volume | 11.79× | £560,000 | £47,494 | 41 | +12.7% | +5.20 |
| — | BridgendWales · W06000013 | Low volume | 7.74× | £286,495 | £37,002 | 28 | +33.3% | +1.29 |
| — | Brighton and HoveSouth East · E06000043 | Indicative | 9.99× | £393,250 | £39,347 | 68 | -5.2% | -1.53 |
| — | Bristol, City ofSouth West · E06000023 | Indicative | 7.85× | £310,000 | £39,509 | 66 | -12.1% | -0.54 |
| — | BromsgroveWest Midlands · E07000234 | Low volume | 9.17× | £392,100 | £42,776 | 32 | +16.1% | -0.54 |
| — | BroxbourneEast of England · E07000095 | Indicative | 12.76× | £590,000 | £46,237 | 71 | +40.5% | -2.56 |
| — | BurnleyNorth West · E07000117 | Indicative | 8.67× | £287,995 | £33,208 | 57 | +130.4% | +1.98 |
| — | BuryNorth West · E08000002 | Low volume | 7.88× | £281,675 | £35,767 | 46 | +14.9% | -0.31 |
| — | CaerphillyWales · W06000018 | Indicative | 8.77× | £310,000 | £35,367 | 79 | +65.5% | +0.83 |
| — | CalderdaleYorkshire and The Humber · E08000033 | Low volume | 7.92× | £285,000 | £35,989 | 37 | +50.0% | +0.87 |
| — | CambridgeEast of England · E07000008 | Low volume | 14.24× | £622,995 | £43,741 | 23 | +26.8% | -1.08 |
| — | Cannock ChaseWest Midlands · E07000192 | Low volume | 8.71× | £314,950 | £36,140 | 15 | +39.4% | -0.36 |
| — | CarmarthenshireWales · W06000010 | Indicative | 6.95× | £259,995 | £37,405 | 98 | +40.5% | +1.76 |
| — | Castle PointEast of England · E07000069 | Low volume | 7.28× | £303,750 | £41,745 | 22 | -15.6% | -10.37 |
| — | CeredigionWales · W06000008 | Low volume | 7.58× | £252,475 | £33,299 | 16 | +12.2% | +2.19 |
| — | CheltenhamSouth West · E07000078 | Low volume | 9.48× | £392,500 | £41,399 | 12 | +22.7% | +0.21 |
| — | ChesterfieldEast Midlands · E07000034 | Indicative | 8.77× | £315,000 | £35,920 | 89 | +65.8% | -1.68 |
| — | ChichesterSouth East · E07000225 | Indicative | 11.59× | £408,775 | £35,264 | 88 | -1.5% | -1.24 |
| — | ChorleyNorth West · E07000118 | Indicative | 8.81× | £346,746 | £39,350 | 57 | +60.2% | +1.27 |
| — | ConwyWales · W06000003 | Low volume | 10.18× | £360,472 | £35,424 | 24 | +65.7% | +2.67 |
| — | CotswoldSouth West · E07000079 | Indicative | 13.33× | £550,000 | £41,267 | 57 | +22.2% | +2.47 |
| — | CrawleySouth East · E07000226 | Low volume | 12.30× | £482,475 | £39,237 | 14 | +36.9% | +2.04 |
| — | CroydonLondon · E09000008 | Low volume | 5.18× | £229,750 | £44,326 | 28 | -45.9% | -6.25 |
| — | DacorumEast of England · E07000096 | Low volume | 14.61× | £650,000 | £44,485 | 19 | +46.1% | +0.01 |
| — | DartfordSouth East · E07000107 | Indicative | 7.18× | £316,675 | £44,091 | 82 | -15.6% | -3.09 |
| — | DenbighshireWales · W06000004 | Low volume | 8.35× | £272,998 | £32,691 | 24 | +41.6% | -0.15 |
| — | Derbyshire DalesEast Midlands · E07000035 | Low volume | 6.97× | £300,000 | £43,071 | 43 | -5.4% | -2.31 |
| — | EastbourneSouth East · E07000061 | Low volume | 2.42× | £89,950 | £37,236 | 12 | -67.6% | -9.01 |
| — | ElmbridgeSouth East · E07000207 | Indicative | 11.17× | £580,000 | £51,924 | 68 | -10.8% | -2.68 |
| — | EnfieldLondon · E09000010 | Low volume | 13.56× | £595,000 | £43,888 | 30 | +25.3% | -1.51 |
| — | Epping ForestEast of England · E07000072 | Indicative | 8.94× | £407,850 | £45,618 | 76 | -22.3% | -7.14 |
| — | ExeterSouth West · E07000041 | Indicative | 10.13× | £349,562 | £34,514 | 90 | +18.5% | -2.57 |
| — | FarehamSouth East · E07000087 | Indicative | 8.80× | £385,000 | £43,740 | 59 | +12.6% | -0.76 |
| — | FlintshireWales · W06000005 | Indicative | 7.33× | £274,995 | £37,505 | 56 | +30.9% | -1.02 |
| — | Folkestone and HytheSouth East · E07000112 | Indicative | 9.38× | £364,500 | £38,864 | 67 | +17.6% | -2.11 |
| — | Forest of DeanSouth West · E07000080 | Low volume | 7.06× | £298,995 | £42,326 | 49 | +10.7% | -1.43 |
| — | FyldeNorth West · E07000119 | Indicative | 7.84× | £351,750 | £44,892 | 79 | +47.8% | +0.87 |
| — | GloucesterSouth West · E07000081 | Indicative | 9.12× | £315,750 | £34,617 | 84 | +26.3% | -0.52 |
| — | GosportSouth East · E07000088 | Low volume | 6.88× | £255,000 | £37,060 | 5 | +1.0% | -5.24 |
| — | GraveshamSouth East · E07000109 | Low volume | 10.45× | £440,925 | £42,199 | 10 | +22.5% | -2.19 |
| — | Great YarmouthEast of England · E07000145 | Indicative | 8.33× | £290,000 | £34,794 | 88 | +34.6% | +0.40 |
| — | GuildfordSouth East · E07000209 | Low volume | 16.56× | £775,000 | £46,801 | 31 | +58.2% | +4.20 |
| — | Hammersmith and FulhamLondon · E09000013 | Low volume | 30.41× | £1,435,000 | £47,192 | 49 | +105.0% | +3.15 |
| — | HarlowEast of England · E07000073 | Low volume | 11.72× | £450,000 | £38,380 | 43 | +34.3% | -1.20 |
| — | HarrowLondon · E09000015 | Indicative | 9.29× | £420,000 | £45,232 | 59 | -24.3% | -1.92 |
| — | HartSouth East · E07000089 | Low volume | 11.59× | £538,750 | £46,502 | 48 | +17.1% | +1.30 |
| — | HastingsSouth East · E07000062 | Low volume | 10.27× | £356,495 | £34,714 | 30 | +29.6% | +1.57 |
| — | HavantSouth East · E07000090 | Indicative | 9.95× | £370,500 | £37,220 | 57 | +15.8% | -0.69 |
| — | HaveringLondon · E09000016 | Low volume | 8.59× | £395,740 | £46,045 | 17 | -12.1% | -0.43 |
| — | HertsmereEast of England · E07000098 | Low volume | 19.12× | £837,500 | £43,813 | 14 | +56.5% | +6.26 |
| — | High PeakEast Midlands · E07000037 | Indicative | 8.95× | £332,950 | £37,184 | 77 | +31.5% | +0.43 |
| — | HillingdonLondon · E09000017 | Low volume | 10.18× | £430,125 | £42,250 | 21 | -15.7% | +0.08 |
| — | HorshamSouth East · E07000227 | Low volume | 13.39× | £582,500 | £43,487 | 24 | +33.9% | +0.90 |
| — | HounslowLondon · E09000018 | Low volume | 16.12× | £658,750 | £40,870 | 42 | +36.9% | +4.80 |
| — | IpswichEast of England · E07000202 | Low volume | 8.37× | £306,872 | £36,660 | 22 | +27.9% | -1.08 |
| — | Isle of AngleseyWales · W06000001 | Low volume | 6.16× | £220,000 | £35,709 | 14 | -1.4% | -3.54 |
| — | Isle of WightSouth East · E06000046 | Low volume | 9.46× | £295,000 | £31,184 | 6 | +11.3% | +1.11 |
| — | IslingtonLondon · E09000019 | Low volume | 32.27× | £1,635,750 | £50,692 | 8 | +161.7% | +16.53 |
| — | Kensington and ChelseaLondon · E09000020 | Low volume | 36.25× | £1,906,000 | £52,576 | 42 | +68.7% | +5.67 |
| — | Kingston upon ThamesLondon · E09000021 | Low volume | 10.13× | £475,000 | £46,871 | 9 | -12.0% | -1.99 |
| — | LambethLondon · E09000022 | Low volume | 11.17× | £547,750 | £49,034 | 32 | +1.8% | -9.16 |
| — | LancasterNorth West · E07000121 | Low volume | 12.47× | £435,000 | £34,890 | 30 | +120.5% | +2.41 |
| — | LeicesterEast Midlands · E06000016 | Low volume | 8.97× | £289,600 | £32,281 | 35 | +19.4% | -1.96 |
| — | LewesSouth East · E07000063 | Low volume | 11.44× | £467,000 | £40,807 | 41 | +22.9% | -0.96 |
| — | LewishamLondon · E09000023 | Low volume | 10.17× | £465,000 | £45,702 | 29 | -3.1% | -3.65 |
| — | LutonEast of England · E06000032 | Low volume | 14.99× | £520,750 | £34,732 | 11 | +65.3% | +6.51 |
| — | MaldonEast of England · E07000074 | Indicative | 10.06× | £436,500 | £43,385 | 91 | +16.4% | +0.11 |
| — | MansfieldEast Midlands · E07000174 | Indicative | 8.71× | £283,167 | £32,525 | 87 | +55.4% | -0.15 |
| — | MedwaySouth East · E06000035 | Indicative | 11.33× | £449,000 | £39,622 | 93 | +46.0% | +0.93 |
| — | Merthyr TydfilWales · W06000024 | Low volume | 8.82× | £309,995 | £35,152 | 14 | +121.4% | +1.49 |
| — | Mid DevonSouth West · E07000042 | Indicative | 9.53× | £352,500 | £36,994 | 92 | +21.6% | -0.95 |
| — | MonmouthshireWales · W06000021 | Indicative | 7.85× | £325,995 | £41,529 | 81 | +5.8% | +0.15 |
| — | Neath Port TalbotWales · W06000012 | Low volume | 6.05× | £219,995 | £36,359 | 31 | +35.0% | -1.86 |
| — | New ForestSouth East · E07000091 | Low volume | 8.30× | £320,000 | £38,571 | 37 | -15.8% | -2.98 |
| — | Newcastle-under-LymeWest Midlands · E07000195 | Indicative | 8.41× | £300,500 | £35,723 | 89 | +58.2% | +5.33 |
| — | North DevonSouth West · E07000043 | Indicative | 12.24× | £399,998 | £32,682 | 50 | +37.9% | +0.49 |
| — | North NorfolkEast of England · E07000147 | Low volume | 10.77× | £370,000 | £34,362 | 25 | +23.3% | -0.16 |
| — | North WarwickshireWest Midlands · E07000218 | Low volume | 9.73× | £390,000 | £40,095 | 49 | +52.9% | -0.46 |
| — | NorwichEast of England · E07000148 | Low volume | 6.52× | £230,000 | £35,263 | 18 | -2.1% | -0.49 |
| — | NottinghamEast Midlands · E06000018 | Low volume | 9.25× | £285,000 | £30,798 | 23 | +42.5% | -0.19 |
| — | Oadby and WigstonEast Midlands · E07000135 | Indicative | 10.19× | £413,825 | £40,617 | 52 | +53.3% | +0.18 |
| — | OldhamNorth West · E08000004 | Indicative | 9.47× | £322,495 | £34,042 | 76 | +59.6% | -0.51 |
| — | OxfordSouth East · E07000178 | Low volume | 16.92× | £732,500 | £43,289 | 22 | +62.8% | +3.41 |
| — | PembrokeshireWales · W06000009 | Low volume | 6.42× | £233,750 | £36,438 | 26 | +5.1% | -0.92 |
| — | PendleNorth West · E07000122 | Low volume | 8.16× | £247,500 | £30,327 | 18 | +76.8% | +0.92 |
| — | PlymouthSouth West · E06000026 | Low volume | 6.81× | £239,495 | £35,186 | 46 | +6.4% | -2.42 |
| — | PowysWales · W06000023 | Indicative | 7.94× | £285,000 | £35,909 | 54 | +17.3% | +1.23 |
| — | ReadingSouth East · E06000038 | Low volume | 8.97× | £365,000 | £40,700 | 11 | +4.3% | -0.64 |
| — | RedbridgeLondon · E09000026 | Indicative | 8.03× | £360,000 | £44,851 | 54 | -29.4% | +0.37 |
| — | Redcar and ClevelandNorth East · E06000003 | Indicative | 6.35× | £222,995 | £35,111 | 94 | +37.6% | -1.52 |
| — | RedditchWest Midlands · E07000236 | Low volume | 8.65× | £305,000 | £35,251 | 9 | +19.6% | -2.80 |
| — | Reigate and BansteadSouth East · E07000211 | Low volume | 13.76× | £597,450 | £43,434 | 44 | +25.3% | +1.33 |
| — | RossendaleNorth West · E07000125 | Low volume | 6.80× | £239,995 | £35,273 | 33 | +31.9% | -2.42 |
| — | RotherSouth East · E07000064 | Low volume | 10.50× | £379,950 | £36,197 | 21 | +6.3% | -1.59 |
| — | RunnymedeSouth East · E07000212 | Indicative | 10.29× | £481,500 | £46,777 | 65 | +7.0% | +0.62 |
| — | RushmoorSouth East · E07000092 | Indicative | 12.60× | £477,500 | £37,883 | 68 | +33.4% | +4.09 |
| — | RutlandEast Midlands · E06000017 | Low volume | 10.21× | £432,498 | £42,355 | 32 | +31.1% | +2.04 |
| — | SandwellWest Midlands · E08000028 | Indicative | 9.93× | £327,995 | £33,029 | 53 | +52.6% | +2.26 |
| — | SevenoaksSouth East · E07000111 | Low volume | 12.26× | £546,500 | £44,581 | 18 | +13.8% | +2.85 |
| — | SloughSouth East · E06000039 | Low volume | 9.61× | £369,794 | £38,483 | 32 | -5.2% | +0.75 |
| — | SolihullWest Midlands · E08000029 | Indicative | 8.20× | £384,748 | £46,896 | 60 | +18.0% | -2.58 |
| — | South StaffordshireWest Midlands · E07000196 | Low volume | 10.18× | £394,950 | £38,788 | 27 | +37.1% | +1.97 |
| — | South TynesideNorth East · E08000023 | Indicative | 6.83× | £230,495 | £33,739 | 53 | +43.2% | -1.65 |
| — | Southend-on-SeaEast of England · E06000033 | Low volume | 14.68× | £610,000 | £41,554 | 7 | +79.4% | +7.35 |
| — | SouthwarkLondon · E09000028 | Low volume | 12.12× | £590,000 | £48,681 | 37 | +9.3% | -3.11 |
| — | SpelthorneSouth East · E07000213 | Low volume | 11.16× | £494,200 | £44,265 | 30 | +6.7% | -1.19 |
| — | St AlbansEast of England · E07000240 | Indicative | 8.36× | £480,000 | £57,396 | 75 | -23.8% | -4.97 |
| — | St. HelensNorth West · E08000013 | Indicative | 7.36× | £274,546 | £37,306 | 88 | +48.4% | +0.33 |
| — | Staffordshire MoorlandsWest Midlands · E07000198 | Indicative | 6.59× | £251,745 | £38,228 | 81 | +11.9% | -2.08 |
| — | StevenageEast of England · E07000243 | Low volume | 11.02× | £465,012 | £42,200 | 32 | +36.9% | +5.23 |
| — | StockportNorth West · E08000007 | Indicative | 12.82× | £504,000 | £39,318 | 97 | +65.3% | +5.94 |
| — | Surrey HeathSouth East · E07000214 | Indicative | 8.25× | £360,000 | £43,633 | 59 | -24.2% | -4.90 |
| — | SuttonLondon · E09000029 | Low volume | 8.66× | £384,375 | £44,393 | 24 | -15.5% | -1.73 |
| — | SwanseaWales · W06000011 | Indicative | 9.74× | £356,248 | £36,586 | 64 | +82.7% | -0.47 |
| — | TamesideNorth West · E08000008 | Indicative | 9.51× | £322,950 | £33,949 | 61 | +53.8% | +1.57 |
| — | TamworthWest Midlands · E07000199 | Indicative | 8.39× | £322,996 | £38,496 | 57 | +39.4% | -2.43 |
| — | TandridgeSouth East · E07000215 | Low volume | 10.18× | £405,000 | £39,775 | 13 | -18.0% | -1.05 |
| — | TeignbridgeSouth West · E07000045 | Indicative | 9.81× | £347,422 | £35,410 | 88 | +17.8% | -1.83 |
| — | Test ValleySouth East · E07000093 | Indicative | 11.58× | £470,000 | £40,576 | 69 | +30.6% | +2.60 |
| — | ThanetSouth East · E07000114 | Indicative | 10.20× | £365,000 | £35,775 | 52 | +25.9% | -2.94 |
| — | Three RiversEast of England · E07000102 | Low volume | 16.71× | £735,000 | £43,980 | 47 | +36.1% | +7.35 |
| — | ThurrockEast of England · E06000034 | Low volume | 10.65× | £447,250 | £41,997 | 16 | +26.0% | +2.73 |
| — | TorbaySouth West · E06000027 | Indicative | 8.96× | £299,998 | £33,493 | 50 | +20.0% | +0.01 |
| — | TorfaenWales · W06000020 | Low volume | 7.66× | £300,000 | £39,170 | 38 | +53.9% | -1.27 |
| — | TorridgeSouth West · E07000046 | Indicative | 9.88× | £340,000 | £34,425 | 97 | +25.0% | +1.90 |
| — | TraffordNorth West · E08000009 | Low volume | 6.85× | £294,250 | £42,973 | 18 | -21.3% | +1.72 |
| — | Tunbridge WellsSouth East · E07000116 | Indicative | 10.88× | £521,248 | £47,896 | 76 | +22.6% | -0.20 |
| — | Vale of GlamorganWales · W06000014 | Low volume | 7.76× | £299,995 | £38,656 | 49 | +8.7% | -0.73 |
| — | WalsallWest Midlands · E08000030 | Indicative | 8.15× | £277,475 | £34,036 | 70 | +26.1% | +3.81 |
| — | Waltham ForestLondon · E09000031 | Indicative | 10.14× | £460,000 | £45,350 | 58 | -14.8% | -2.19 |
| — | WandsworthLondon · E09000032 | Indicative | 13.36× | £729,000 | £54,584 | 97 | +15.7% | -2.79 |
| — | WarringtonNorth West · E06000007 | Indicative | 10.03× | £404,995 | £40,380 | 55 | +62.0% | -0.38 |
| — | WatfordEast of England · E07000103 | Indicative | 9.79× | £423,203 | £43,219 | 67 | -0.4% | -0.89 |
| — | Welwyn HatfieldEast of England · E07000241 | Indicative | 10.04× | £453,250 | £45,145 | 69 | +3.0% | +1.41 |
| — | West DevonSouth West · E07000047 | Indicative | 8.61× | £332,496 | £38,638 | 91 | +10.8% | -3.65 |
| — | West OxfordshireSouth East · E07000181 | Low volume | 10.64× | £467,500 | £43,932 | 34 | +18.4% | -0.99 |
| — | WestminsterLondon · E09000033 | Low volume | 50.47× | £2,655,000 | £52,610 | 47 | +212.3% | +19.47 |
| — | Windsor and MaidenheadSouth East · E06000040 | Indicative | 13.56× | £642,500 | £47,387 | 98 | +17.9% | +3.30 |
| — | WirralNorth West · E08000015 | Low volume | 8.94× | £339,995 | £38,010 | 44 | +58.1% | +5.49 |
| — | WokingSouth East · E07000217 | Indicative | 8.58× | £375,000 | £43,719 | 58 | -14.3% | -4.24 |
| — | WolverhamptonWest Midlands · E08000031 | Low volume | 6.39× | £228,995 | £35,858 | 48 | +4.1% | -0.83 |
| — | WorcesterWest Midlands · E07000237 | Low volume | 4.89× | £190,000 | £38,880 | 5 | -26.9% | -5.45 |
| — | WorthingSouth East · E07000229 | Low volume | 10.25× | £375,000 | £36,581 | 14 | +7.1% | +3.44 |
| — | WrexhamWales · W06000006 | Low volume | 8.40× | £295,995 | £35,246 | 31 | +52.0% | -0.31 |
| — | WychavonWest Midlands · E07000238 | Indicative | 8.98× | £325,000 | £36,175 | 93 | -0.6% | -2.19 |
Methodology
What the ratio means
The core measure is the median price paid for a newly built dwelling divided by median gross annual full-time earnings for residents of the same area. A ratio of 9.0 means the median new-build price is nine times median annual earnings.
Headline ranked markets recorded at least 100 new-build sales in the year. Markets with 50 to 99 sales are shown as indicative. Markets below 50 sales remain available in the table and download but carry a low-volume warning. Suppressed or non-numeric 2025 values are not ranked or filled.
The index does not account for household income, deposits, interest rates, mortgage terms, buyer incentives, shared ownership, service charges, property size or the mix of homes sold. It is a relative affordability indicator, not a mortgage-eligibility calculation.
Research partnerships
Put your brand alongside the next PBI data release
PBI works with property-sector organisations on clearly labelled sponsorship, contributed expertise and follow-on regional analysis. Editorial conclusions and methodology remain under PBI control.
Downloads
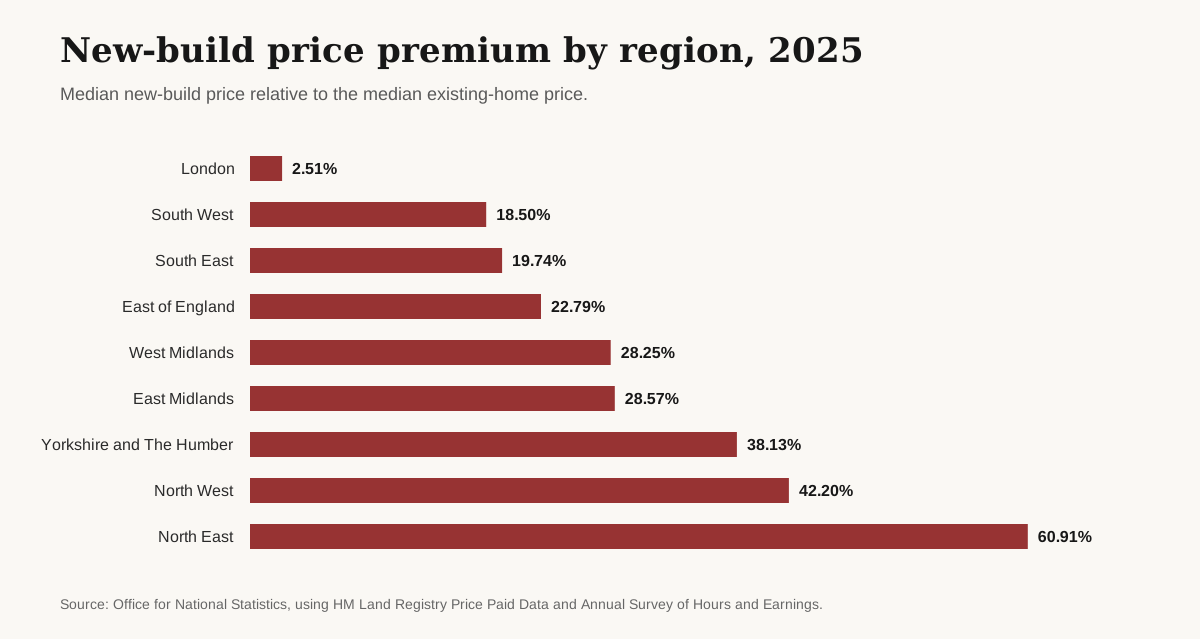
Sources and attribution
Source: Office for National Statistics, using HM Land Registry Price Paid Data and Annual Survey of Hours and Earnings.
- New-build affordability ratios
- New-build residential property sales
- Existing-home affordability ratios
- Existing-home median prices
Contains public sector information licensed under the Open Government Licence v3.0.
Suggested citation
Property Business Insights (2026), England and Wales New-Build Affordability Index 2026, using Office for National Statistics data. https://www.propertybusinessinsights.com/insights/new-build-affordability-index